As a TonePedia embed client, during the first week of each month, you will receive the analytics report for previous month.
The main values used to report on the usage of your embeds are the following:
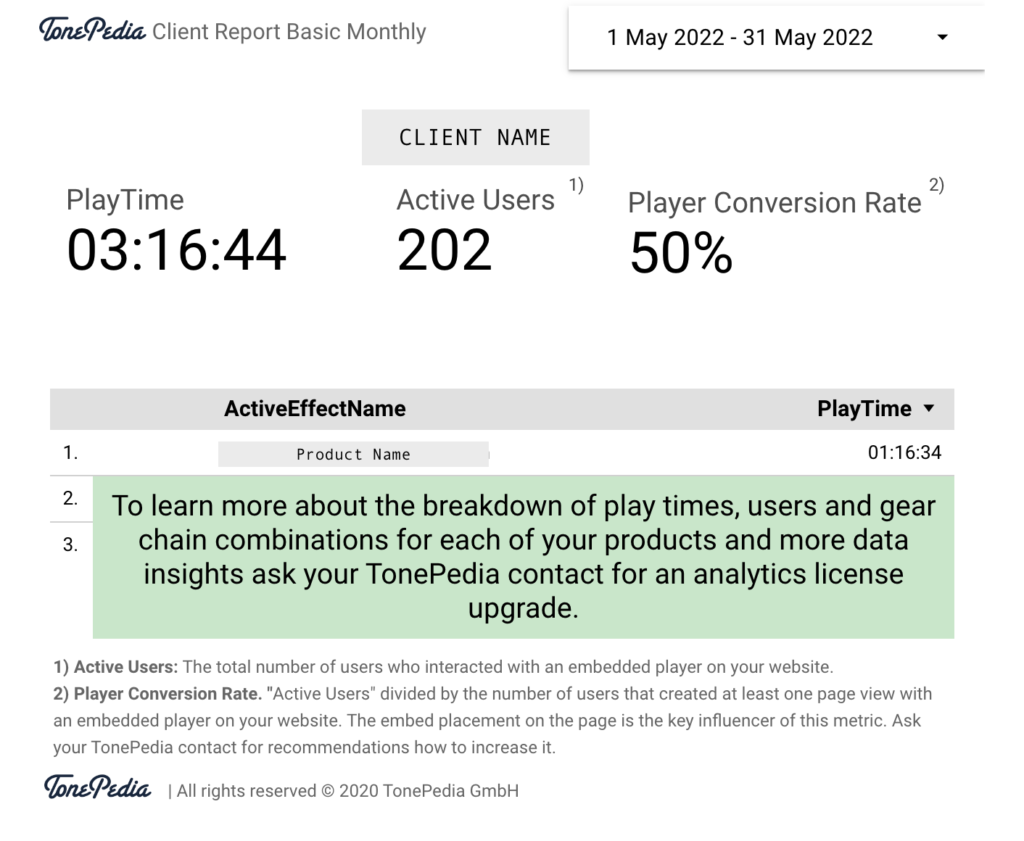
- Playtime: The total amount of streamed audio in hours, minutes and seconds by all users in the reported period.
- Active Users: The total number of users who interacted with an embedded player on your website.
- Player Conversion Rate. “Active Users” divided by the number of users that created at least one page view with an embedded player on your website. The embed placement on the page is the key influencer of this metric. Ask your TonePedia contact for recommendations how to increase it.
Depending on your type of embed license you will receive a basic report with the aggregated numbers for your brand or advanced analytics breaking down user behavior and detailed product usage.
As you may already know, due to limitations by ad-blocker plugins and browser privacy settings TonePedia as a 3rd party application can track only a portion of your overall traffic. The reports are based on that portion only. Therefore, the ratios are usually representative but the overall values are lower than the actual usage.
The 3 different report types based on your license level are:
- Basic “Know”
- Advanced “Understand”
- VIP “Do”
1. Basic “Know” Report #

The Basic Report includes the total values for all of the client’s embed player for PlayTime, Active Users and Player Conversion Rate and a snapshot for the most played product.
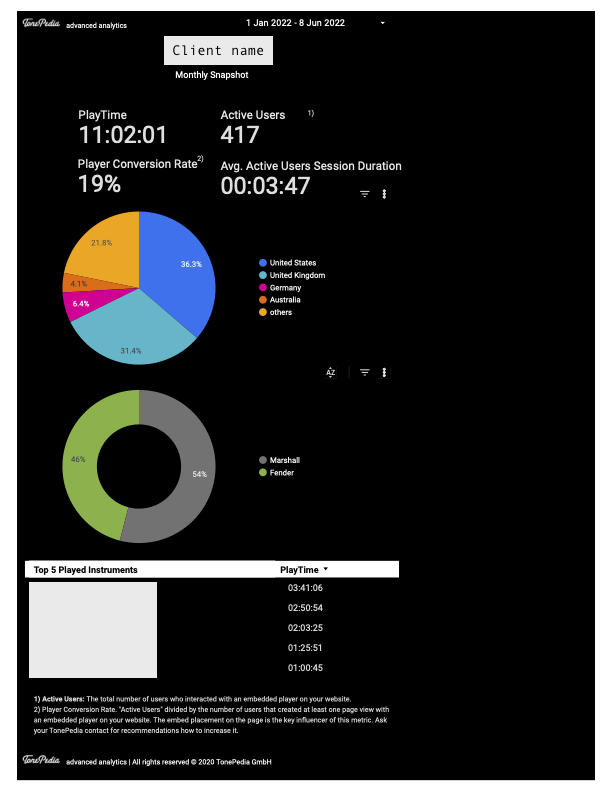
2. Advanced “Understand” Report #

In addition to the values of the Basic Report, the Advanced Report includes a country and by-product split as well as the Top 5 most played instruments in the client embed players.
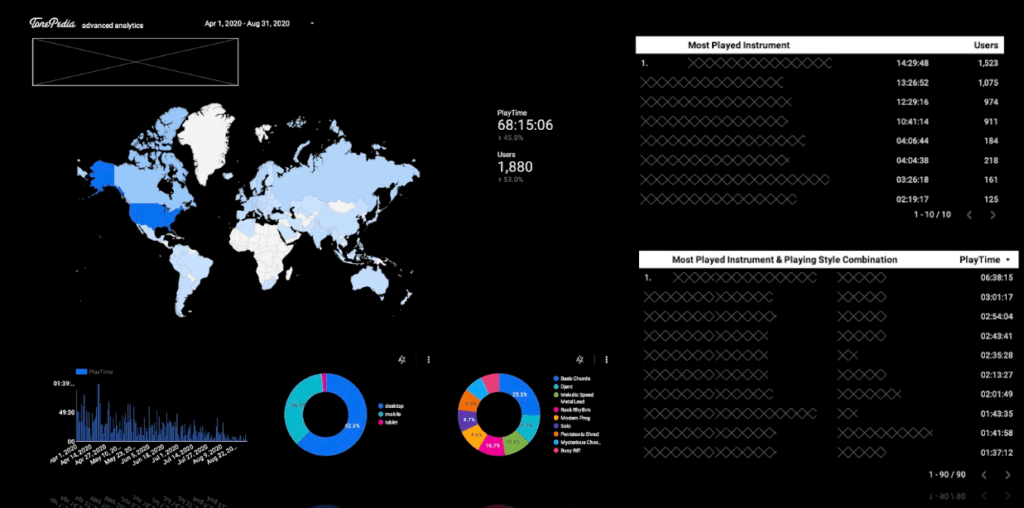
3. VIP “Do” Report #

In addition to the values of the the Advanced Report, the VIP Reports includes daily breakdowns, full rankings of gear chain combinations to identify cross-selling potential as well as the option to integrate directly with the client’s Google Analytics account.
